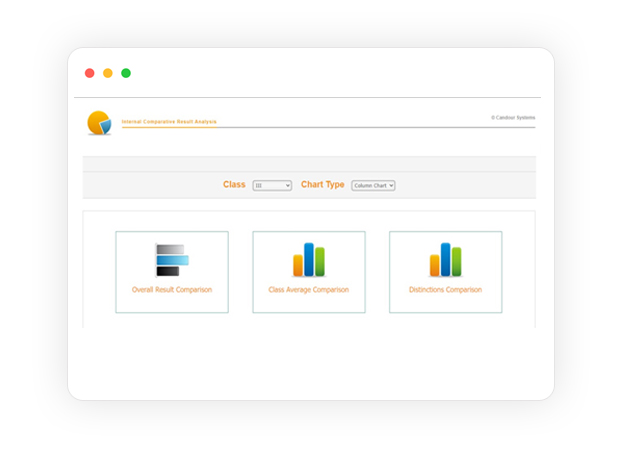



Graphical Presentation of Data and Reports is a crucial feature within a School Management System (SMS) or School ERP that helps educational institutions visualize and communicate complex data in an accessible and visually appealing manner.
Here are key aspects and benefits of this feature:
Features
1. Graphs and Charts
- Offers a variety of chart types, such as bar charts, line graphs, pie charts, and scatter plots, to represent data effectively.
2. Customizable Reports
- Allows users to create custom reports by selecting specific data sets, time frames, and criteria for analysis.
3. Real-Time Insights
- Provides real-time data updates and insights, ensuring that stakeholders have access to the latest information.
4. Interactive Dashboards
- Offers interactive dashboards with drill-down capabilities, enabling users to explore data at different levels of detail.
5. Data Comparison
- Facilitates data comparison by presenting multiple data sets side by side or overlaying them on the same chart.
6. Export and Sharing
- Allows users to export graphical reports in various formats (e.g., PDF, Excel) and share them with stakeholders.
7. Data Filters
- Enables users to apply filters to focus on specific data subsets, enhancing data relevance.
Benefits
- Data Clarity: Graphical representation simplifies complex data, making it easier for stakeholders to understand and interpret information.
- Visual Appeal: Charts and graphs are visually appealing and engage users more effectively than raw data or text reports.
- Data-Driven Decision-Making: Empowers educators, administrators, and stakeholders to make informed decisions based on visualized data trends and patterns.
- Accessibility: Users can access graphical reports from anywhere with an internet connection, facilitating remote monitoring and decision-making.
- Real-Time Monitoring: Provides real-time insights into key performance indicators, allowing immediate action when needed.
- Performance Tracking: Allows schools to track student attendance, academic performance, staff performance, and other metrics in a dynamic and accessible way.
- Efficiency: Saves time by presenting data in a format that is quickly digestible, reducing the need to sift through large datasets.
- Communication: Enhances communication by effectively conveying data trends and insights to stakeholders, fostering collaboration and accountability.
- Goal Tracking: Supports the tracking of progress toward academic goals, performance targets, and improvement initiatives.
Graphical Presentation of Data and Reports is a powerful tool for educational institutions. It transforms raw data into actionable insights, promotes data-driven decision-making, and enhances communication among stakeholders. This feature is essential for monitoring and improving school performance, student outcomes, and overall operational efficiency.